





A professional solar inverter efficiency comparison must look beyond the highest percentage printed on a datasheet. Maximum inverter efficiency is measured at an optimal operating point, while real PV plants operate under continuously changing irradiance, DC voltage, temperature, power factor, clipping, and grid-control conditions.
For commercial and industrial projects, the most important question is not simply, “Which inverter has the highest efficiency?” It is, “Which inverter architecture will deliver the most reliable exported energy at the lowest lifecycle cost under this project’s operating conditions?”
That assessment should include certified weighted efficiency and part-load efficiency curves, while also considering MPPT behavior, voltage selection, thermal derating, auxiliary consumption, availability, grid compliance, warranty terms, monitoring, and service capability. A difference of 0.5–1 percentage point can become financially significant over a 20- to 25-year operating period. However, the final system-yield difference may be smaller—or even reversed—once clipping, mismatch, downtime, reactive power, and maintenance are considered.
This guide explains how EPC companies, installers, resellers, system integrators, facility owners, and project developers can normalize supplier data and translate inverter specifications into annual energy, net present value, and PV system LCOE.
For most yield studies and procurement decisions, European or CEC weighted efficiency is more useful than maximum efficiency.
Maximum efficiency identifies the best conversion performance achieved under a favorable combination of DC voltage, temperature, and loading. It is useful for confirming the technical capability of an inverter, but it does not describe performance throughout a typical year.
Weighted efficiency combines measurements at several load levels. European efficiency gives greater relevance to the mid-load operation associated with many European irradiance profiles. CEC efficiency uses a weighting methodology developed for the US market. The appropriate value depends on the project region, applicable certification requirements, climate, and energy-modeling convention.
Even weighted values should not be used without context. Two products with the same European efficiency can have different low-load curves, thermal limits, voltage-dependent performance, and auxiliary consumption. For a northern European rooftop, strong performance between 10% and 60% of rated power may be particularly valuable. At a hot, high-irradiance site, cooling capability and temperature derating may dominate.
For US projects, the exact model should be checked against the official California Energy Commission solar equipment listings rather than relying solely on a commercial datasheet.
The following ranges are indicative rather than product guarantees. Every value should be verified against the current datasheet, certified report, firmware version, DC operating voltage, and temperature conditions for the model under consideration.
| Inverter architecture | Representative maximum efficiency | Representative weighted efficiency | Main system-level consideration |
|---|---|---|---|
| Three-phase commercial string inverter | 98.2–99.0% | 97.5–98.7% | Strong MPPT granularity, modular maintenance |
| Utility-scale central inverter | 98.5–99.0% | 98.0–98.7% | High block efficiency, greater outage concentration |
| Micro-onduleur | 96.0–97.5% | Commonly below large string equipment | Module-level mismatch and shading recovery |
| String inverter with DC optimizers | Inverter may reach commercial string ranges, but optimizers add a conversion stage | Must be assessed as a complete architecture | Potential mismatch recovery versus optimizer losses |
These values are only comparable when the measurement boundaries are equivalent. A string inverter’s DC-to-AC efficiency should not be compared directly with a system figure that includes optimizer conversion, AC cabling, a medium-voltage transformer, or station auxiliaries.
DC voltage selection is also a critical factor. A product may report maximum efficiency at one nominal input voltage but operate at a different voltage in the proposed array. Procurement teams should request efficiency curves at the expected DC voltage, not merely accept the highest published value.
A sustained effective conversion advantage can produce meaningful additional energy. If 10,000 MWh reaches the inverter DC terminals annually, a genuine 0.5-percentage-point reduction in conversion loss would correspond to approximately 50 MWh before considering other system effects. Over a 25-year period, the cumulative gross difference would depend on the annual DC energy profile and the module-degradation assumptions.
However, a one-percentage-point difference between two maximum efficiency ratings does not necessarily create a one-percentage-point difference in exported energy. The inverters may reach their maximum values at different operating points and spend little time there. Their weighted efficiencies may be much closer. Clipping, cable losses, thermal derating, curtailment, mismatch, reactive power, and availability can further narrow or reverse the result.
The commercial impact should therefore be calculated using annual kWh, discounted revenue, net present value, and LCOE. A percentage difference without a defined measurement boundary and operating profile is not sufficient for investment decisions.
A normalized assessment should proceed in the following order:
This hierarchy prevents a marginal efficiency advantage from obscuring a more important weakness. An inverter with slightly lower certified efficiency may deliver more lifetime energy if it remains online for longer, manages heat more effectively, detects faults earlier, or can be repaired quickly with local spare parts.
Inverter conversion efficiency is calculated as:
Efficiency = AC output power ÷ DC input power × 100
The input and output must be measured at clearly defined boundaries and under the same conditions. AC output should also be interpreted carefully when the inverter is supplying reactive power, because active power, reactive power, and apparent power are not interchangeable.
A single inverter can legitimately publish different maximum, European, and CEC efficiency values.
| Métrique | Illustrative result | What it indicates |
|---|---|---|
| Maximum efficiency | 98.90% | Best measured conversion point |
| European efficiency | 98.40% | Weighted performance emphasizing a European-style load profile |
| CEC efficiency | 98.20% | Weighted performance under the applicable CEC methodology |
| Modeled annual site efficiency | 98.00% | Project-specific result after voltage, temperature, and operating-profile effects |
There is no contradiction in these values. They answer different questions. Maximum efficiency describes the best operating point, weighted efficiency approximates performance across selected loads, and modeled annual efficiency estimates operation at a specific site.
Le IEC 61683 photovoltaic inverter efficiency measurement standard establishes procedures for measuring the efficiency of power conditioners used in photovoltaic systems. It provides an important basis for more consistent laboratory comparison, although it does not remove the need for project-specific modeling.
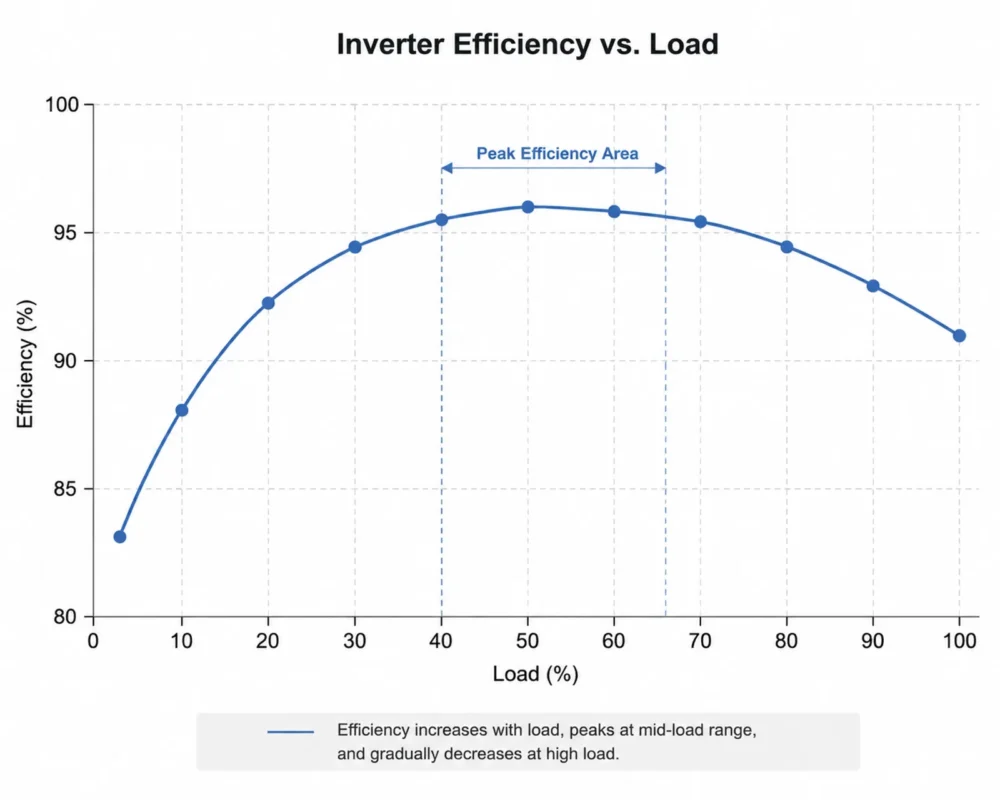
An inverter consumes energy to operate control electronics, switching devices, communications, sensors, contactors, fans, and other internal systems. At high output, these fixed losses represent a small share of converted power. At low output, they become proportionally larger.
For example, a 5 kW internal loss is only 0.05% of output when a large inverter is delivering 10 MW, but it represents 1% when output falls to 500 kW. The actual loss structure is more complex, yet the principle explains why efficiency generally falls at low load.
Differences between products often become more visible below approximately 20–30% of rated output. That makes the full part-load efficiency curve important for cloudy markets, arrays with east-west orientations, self-consumption projects with export constraints, and installations experiencing extended morning or evening production.
A strong part-load efficiency curve can be more valuable than a marginally higher peak efficiency rating. EPCs should request efficiency data at several load points and at the proposed operating voltage. Where possible, those curves should be entered into the project’s energy model instead of using one constant conversion-loss assumption.
Modern commercial inverters commonly report MPPT efficiency above 99%. Consequently, conversion losses, thermal behavior, wiring, and architecture can be more significant than basic tracking error in many well-designed projects.
Static MPPT efficiency indicates how accurately the inverter finds and holds a stable maximum power point. Dynamic MPPT efficiency measures performance as irradiance and the array’s current-voltage characteristics change. Dynamic behavior matters under moving clouds, variable shading, and other rapidly changing conditions.
A broad MPPT window does not mean efficiency is uniform throughout that window. Normal string voltage should remain close to the inverter’s efficient operating region after accounting for module temperature, degradation, cable voltage drop, and irradiance. Designing merely to stay inside the permitted range can reduce potential energy yield.
The lowest expected temperature is normally used to check that string open-circuit voltage remains below the inverter’s absolute maximum input voltage. High operating temperature is used to confirm that string voltage remains above the minimum MPPT or full-power voltage. Both safety margins and efficiency margins are required.
Standardized testing helps normalize products, but a laboratory cannot reproduce every field condition. A C&I rooftop may expose an inverter to high enclosure temperatures, direct solar radiation, restricted airflow, dust, voltage fluctuation, contaminated filters, and repeated reactive power commands.
Field efficiency can also appear incorrect because of measurement problems. DC sensors and AC revenue meters may have different accuracy classes or timestamps. If rapidly changing DC input is compared with an AC value recorded several seconds later, the calculated efficiency may temporarily exceed 100% or fall far below the true value.
Certified reports and recognized equipment databases should therefore take priority over unverified marketing statements. Field validation should use synchronized measurements, defined meter accuracy, load bins, and temperature normalization.
Large central inverters can achieve weighted efficiencies of around 98.0–98.7% and may operate close to rated power for substantial periods in well-sized utility blocks. Their block-based architecture concentrates conversion equipment and service activity, while medium-voltage station design remains project-specific.
Their main operational trade-off is outage concentration. A single central-inverter fault can remove a large plant block until repair is completed. This exposure can be reduced through block redundancy, spare assemblies, service contracts, and appropriate station design, but it must be quantified.
Large string inverters now offer similar headline efficiency with finer MPPT granularity. Commercial solar inverters can isolate different array zones and reduce the production impact of one equipment failure. Their distributed architecture may, however, increase the number of AC collection circuits, communication endpoints, service locations, and field-replaceable units.
Neither architecture is automatically more efficient at plant level. Central equipment may perform very well in uniform, high-loading blocks. String architecture may recover more energy where terrain, tracker zones, module behavior, or shading create electrical mismatch.
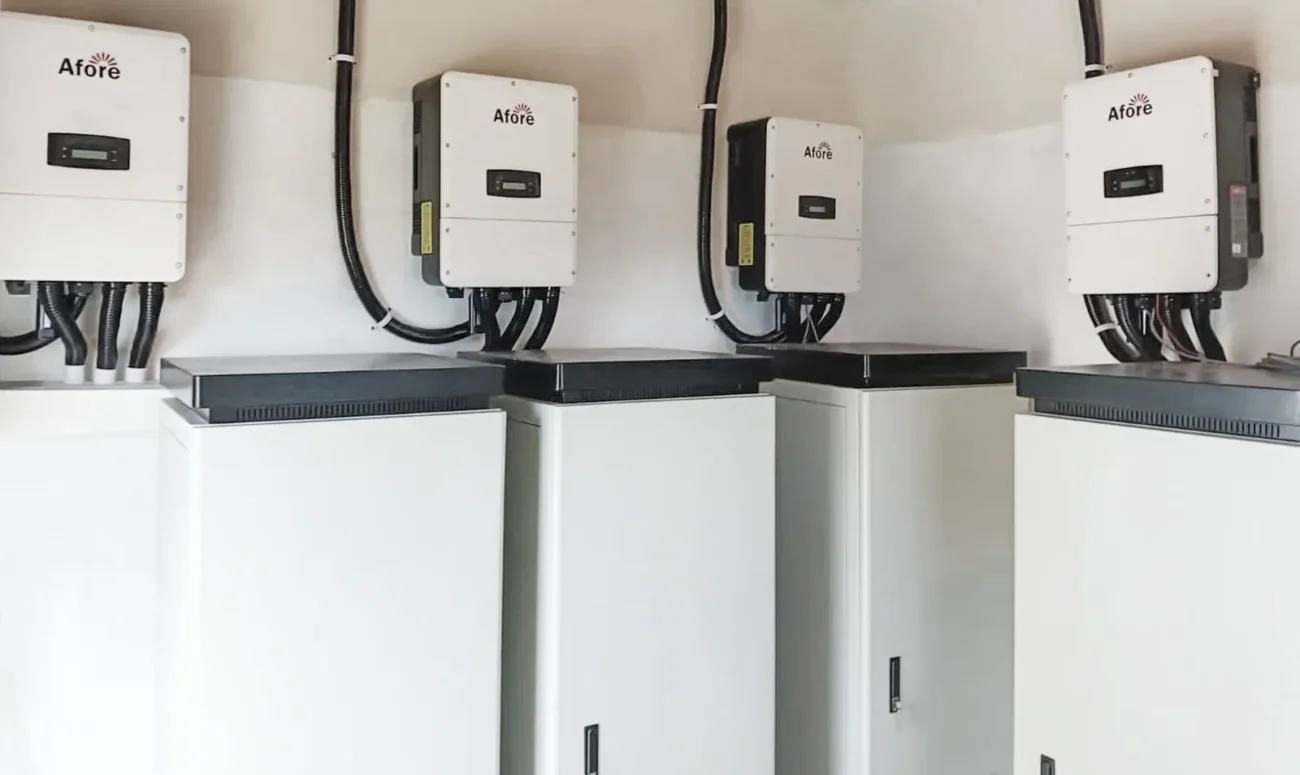
Transformerless inverters generally achieve higher conversion efficiency because they avoid transformer core, winding, and magnetizing losses inside the inverter. They are common in modern commercial and utility PV systems, particularly where isolation is provided elsewhere in the electrical architecture.
Galvanic isolation may still be required or preferred because of module technology, grounding arrangements, leakage-current behavior, electrical design, or local rules. A transformer-based solution should not be rejected only because its conversion efficiency is lower.
The EPC must assess the complete topology, including module compatibility, residual-current monitoring, insulation behavior, grounding, medium-voltage transformation, and protection coordination. Moving a transformer outside the inverter does not eliminate transformer losses from the plant; it changes the measurement boundary.
At device level, commercial string inverters usually offer higher conversion efficiency. Leading three-phase string equipment may reach maximum efficiencies of 98.2–99.0%, while typical microinverter maximum efficiencies are approximately 96–97.5%.
At system level, the answer depends on the roof. Microinverters independently control modules, which can recover energy where shading, module mismatch, multiple orientations, or unusual roof geometry would otherwise reduce string output. Their lower conversion efficiency can therefore be offset by mismatch recovery.
For large, uniform C&I arrays, multi-MPPT string architecture often provides a stronger cost-to-yield ratio. It avoids placing electronics on every module while retaining sufficient electrical granularity for conventional roof zones. Microinverter architecture is more likely to be justified where module-level control or monitoring produces measurable project value.
DC optimizers create another conversion stage, typically introducing approximately 1–2% loss in the DC path depending on product, loading, voltage, and temperature. That loss may be worthwhile if the optimizers recover more energy from severe shading, mixed orientations, irregular module counts, or persistent mismatch.
The break-even point should be established by simulation. The baseline string design and optimizer design must use the same weather file, shading scene, module assumptions, degradation, downtime, and electrical-loss boundaries.
Hardware implications also matter. An optimizer-based system adds rooftop electronics, connectors, communication dependencies, failure points, and replacement work. It may offer module-level monitoring, but the value of that data depends on alarm quality, platform continuity, and the O&M team’s ability to act on it.
Commercial and utility projects commonly use DC/AC ratios around 1.2–1.5, although the correct value depends on climate, module characteristics, tariff structure, interconnection limits, tracker design, degradation, and project economics.
A higher DC/AC ratio keeps the inverter at efficient load levels for longer and increases generation during lower-irradiance periods. It also creates clipping when available DC power exceeds the inverter’s active power limit.
Zero clipping is rarely the correct optimization target. Avoiding all clipping may require more inverter capacity that remains underutilized for much of the year. Conversely, excessive oversizing can waste high-value production and increase module or balance-of-system cost without a proportionate energy benefit.
The correct decision comes from comparing annual exported energy, PPA value, demand-offset value, CAPEX, and LCOE. Time-of-use pricing is especially important: clipping during a high-price period may be more expensive than the same lost kWh during a low-price period.
String configuration must account for minimum temperature, maximum open-circuit voltage, expected operating temperature, module degradation, cable voltage drop, and the inverter’s full-power MPPT range.
An array operating near the lower MPPT limit may experience reduced power capability during hot conditions. Operations close to the upper limit can create an overvoltage risk in cold weather. Even where the design remains technically valid, operation far from nominal voltage may increase conversion loss.
In suitable projects, a well-matched voltage design can recover approximately 0.2–0.5% of annual yield compared with a technically valid but poorly optimized string layout. The exact value is site- and model-specific, so procurement specifications should request voltage-dependent efficiency data.
MPPT count alone is not a sufficient comparison. Engineers must check whether trackers are electrically independent, how many strings share each tracker, the maximum operating and short-circuit current, and whether current limits apply per input or per MPPT.
This is particularly important for C&I roofs divided by parapets, HVAC equipment, access routes, fire zones, and different orientations. Strings with materially different irradiance profiles should not be placed on the same tracker unless the expected mismatch has been modeled and accepted.
Future changes should also be considered. Roof equipment may be added, modules may need replacement, and expansion may introduce new orientations or module ratings. An architecture with practical MPPT flexibility can preserve system performance over asset life.
In northern and cloudy markets, the inverter may spend more time between 10% and 60% load. Part-load efficiency, startup behavior, sleep thresholds, and dynamic MPPT performance therefore deserve close attention.
In hot, high-irradiance markets, thermal derating and cooling capacity may dominate the comparison. Two inverters with identical weighted efficiency can deliver different annual output if one begins derating at a lower enclosure temperature or cannot reject heat effectively at the proposed installation location.
Altitude can reduce cooling effectiveness and may require power derating. Dust can obstruct heat exchangers or filters. Humidity, condensation, and salt exposure can affect insulation and component reliability. Site modeling should use local weather files and manufacturer curves covering temperature, altitude, and power factor.
Passive cooling, forced-air systems, and more specialized cooling approaches each have advantages and limitations. No cooling method is universally superior.
Passive designs remove fan consumption and reduce moving parts, but require sufficient heat-transfer area and appropriate installation conditions. Forced-air cooling can maintain power density and component temperatures, but depends on fan operation, airflow, filter condition, and maintenance. The relevant question is whether the complete design maintains output within the site’s expected thermal envelope.
Direct sunlight, rooftop heat, insufficient cabinet spacing, blocked ventilation, and recirculated exhaust air can cause sustained derating. A small certified efficiency advantage can be quickly outweighed if an inverter repeatedly limits power during peak-production hours. Persistent high temperature may also accelerate component aging.
A complete inverter energy loss assessment should include nighttime consumption, control electronics, communications devices, fans, anti-condensation heaters, switchgear, plant controllers, and station auxiliaries.
Poorly optimized standby and low-irradiance consumption may account for approximately 0.3–0.8% of annual energy in some portfolio-scale systems. The value varies substantially with architecture, climate, station design, and measurement boundary.
Suppliers should disclose measured nighttime power, sleep-mode behavior, wake-up thresholds, heater control, and whether auxiliary consumption is supplied from the PV array, the AC grid, or a separate station circuit. Centralized plant loads should not disappear from the comparison simply because they are outside the inverter enclosure.
Commissioning should verify that the installed system matches the assumptions in the energy model. The process should cover:
Initial records create an evidence base for later warranty or underperformance investigations. Without them, it can be difficult to distinguish an equipment problem from a design, installation, meter, or grid issue.
SCADA should capture DC input, AC active power, reactive power, loading, internal temperature, clipping, thermal derating, grid-commanded limitation, alarms, and availability.
A daily ratio of AC energy to DC energy is not enough for diagnosis. The analysis should group data into load and temperature bins, exclude invalid nighttime values, and account for meter uncertainty. Similar operating periods can then be compared across inverter blocks.
This approach helps identify whether lower performance is caused by conversion loss, restricted airflow, abnormal DC voltage, grid curtailment, sensor error, or downtime. Monitoring quality is therefore part of operational efficiency, not merely a reporting feature.
Grid codes may require fixed power factor, volt-VAR response, plant-level voltage control, or reactive power capability during low active-power operation. Supplying reactive power increases current and associated losses even if the nominal inverter efficiency rating is unchanged.
Yield models should distinguish conversion loss from grid-service effects. If one bidder models unity power factor while another includes the required reactive power profile, their annual energy figures are not comparable.
The same principle applies to active power reserve, frequency response, export limits, and ramp-rate control. These are operational requirements, not necessarily evidence of inverter underperformance.
Total harmonic distortion, voltage support, frequency response, ramp-rate control, and fault ride-through belong in the procurement assessment alongside efficiency.
A marginally more efficient inverter is unsuitable if it cannot comply with the interconnection agreement. Plant-controller compatibility, communication latency, control hierarchy, and validation under expected grid conditions can determine whether a plant reaches commercial operation and remains compliant.
In Europe, the Requirements for Generators framework establishes important principles for generator connection, including capabilities relevant to voltage, frequency, and fault response. National implementation and grid-operator requirements must then be checked for the specific project.
For each project jurisdiction, certificate validity should be verified for the exact inverter model and firmware. Applicable reactive power, ramp-rate, voltage-control, and fault ride-through obligations should be incorporated into both the technical design and yield model.
Future expansion can change inverter loading, plant-controller requirements, export limits, and protection settings. Procurement should consider whether monitoring licenses, communication capacity, controller hardware, and grid certification can support the planned final capacity.
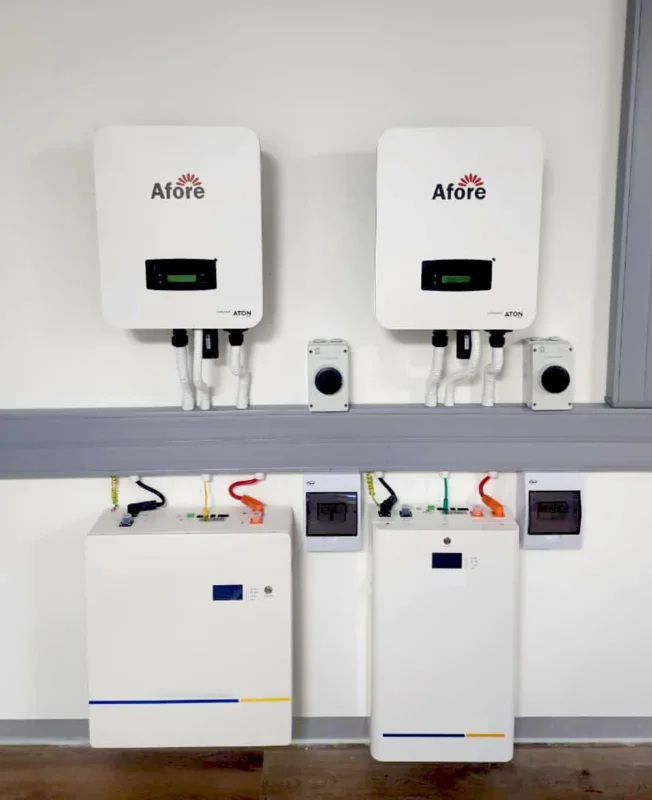
Storage adds further complexity. A conventional PV-to-grid efficiency cannot be compared directly with hybrid solar inverter systems or DC-coupled configurations that may charge and discharge a battery through additional conversion stages. For storage-ready projects, the relevant metrics include PV-to-grid efficiency, PV-to-battery efficiency, battery-to-grid efficiency, round-trip efficiency, standby consumption, and dispatch availability.
All bidders should use the same measurement boundaries. Otherwise, one may exclude battery auxiliaries or transformer losses that another includes.
Consider an inverter with a 0.3-percentage-point conversion advantage but 0.5% lower annual availability. Unless another design benefit offsets the downtime, the theoretically more efficient product may export less energy.
Architecture changes the impact. A central inverter outage can remove a large power block. A single string inverter failure affects a smaller portion of the plant but creates more distributed service points. The comparison should include failure probability, affected capacity, mean time to detect, mean time to repair, and spare-part availability.
Guaranteed availability is useful only when its definition is clear. Exclusions for grid outages, communications failures, planned maintenance, temperature events, and spare-part delays can materially change the practical value of the guarantee.
Warranty length alone does not define lifecycle risk. EPCs and owners should examine labor coverage, shipping responsibilities, replacement lead times, on-site response, diagnostic support, firmware maintenance, exclusions, and the process for proving a claim.
For resellers, channel continuity and regional inventory are also important. Installer training, escalation procedures, service documentation, and access to replacement units affect customer outcomes long after the initial sale.
These terms should be converted into OPEX and downtime assumptions. A cheaper inverter may require more project-owned spares or higher service reserves. A more expensive product may justify its premium if it reduces failure exposure and recovery time.
Certified laboratory efficiency should be separated from real-world fleet performance. References should come from projects with similar climate, voltage, system size, installation environment, and grid behavior.
Independent multi-year comparisons remain limited, and fleet results can be distorted by differences in design and maintenance. A lower-performing plant does not automatically indicate an inferior inverter if it also has more shading, higher DC loading, greater curtailment, or weaker O&M.
The strongest assessment combines certified reports, current technical documentation, independent laboratory evidence, expert review, and operating data from comparable assets. Modeled assumptions should be clearly identified rather than presented as measured results.
Replacing an older inverter in the approximately 96–97% efficiency range with modern 98–99% equipment may contribute to a broader 1–3% annual energy improvement when conversion efficiency, availability, MPPT behavior, and monitoring are considered together.
Repowering is not a simple like-for-like purchase. The new equipment must be compatible with existing string voltage, current, grounding, transformers, protection, plant controls, communications, and grid approvals. Changes to fault current, reactive power capability, or firmware may trigger new interconnection studies.
The business case should compare continued operation, partial refurbishment, and complete replacement. Remaining warranty, expected failure cost, lost revenue during installation, spare availability, and extension of project life all affect the result.
Consider a 10 MW C&I portfolio with 16,000 MWh of annual modeled energy reaching the inverter DC terminals. Two alternatives are compared under the same weather file and degradation assumptions.
| Annual-energy item | Alternative A | Alternative B |
|---|---|---|
| DC energy at inverter input | 16,000 MWh | 16,000 MWh |
| Modeled conversion loss | 1.60% | 1.20% |
| Energy after conversion | 15,744 MWh | 15,808 MWh |
| Clipping loss | 180 MWh | 220 MWh |
| Disponibilité | 99.70% | 99.40% |
| Curtailment | 1.00% | 1.00% |
| Approximate exported energy | 15,362 MWh | 15,340 MWh |
Alternative B has the lower conversion loss and initially gains 64 MWh. However, its higher clipping and lower assumed availability reverse the outcome, leaving it approximately 22 MWh behind Alternative A.
This is an illustrative calculation rather than a universal result. It demonstrates why a datasheet advantage cannot be converted directly into PPA revenue. Comparison models must use identical weather, degradation, DC/AC ratio, voltage, availability definitions, curtailment, and grid constraints.
Incremental inverter cost should be evaluated against additional lifetime kWh, avoided downtime, maintenance expenditure, replacement timing, spare inventory, and discounted revenue.

A higher-efficiency product may not produce the lowest LCOE if it increases CAPEX, requires more complex balance-of-system equipment, or lacks local service. Conversely, a modest price premium may be justified where the inverter improves annual yield and reduces operating risk.
Sensitivity analysis is preferable to a single forecast. At minimum, the model should test low, base, and high cases for availability, repair time, curtailment, degradation, replacement cost, electricity value, and discount rate. This reveals whether a procurement recommendation remains robust when conditions change.
| Project scenario | Likely comparison focus | Typical decision driver |
|---|---|---|
| Uniform C&I rooftop | Multi-MPPT string alternatives | Weighted efficiency, thermal stability, service access |
| Partially shaded commercial roof | Standard strings versus optimizers | Mismatch recovery versus conversion loss and rooftop complexity |
| Utility ground-mount plant | Central versus distributed string | Availability, clipping, MPPT granularity, collection design and O&M |
On a uniform C&I roof, optimizers or microinverters may add cost and conversion stages without recovering enough mismatch to justify them. A conventional multi-MPPT string design will often be the baseline.
At a partially shaded site, the result depends on the shading distribution. If only a small roof area is affected, selective optimization or separate MPPT allocation may be preferable to module-level electronics across the entire installation.
For a utility plant, central and string architectures can have very similar conversion efficiency. The decision may turn on terrain, tracker blocks, medium-voltage design, spare strategy, repair resources, and the financial impact of concentrated versus distributed outages.
Weightings should reflect the project rather than a universal ranking.
| Procurement category | Illustrative weighting |
|---|---|
| Certified weighted and part-load efficiency | 15% |
| DC voltage range, current limits, and MPPT design | 12% |
| Temperature, altitude, and thermal derating | 10% |
| Grid compliance and plant-controller compatibility | 15% |
| Availability and demonstrated reliability | 15% |
| Warranty, service, and spare-parts strategy | 12% |
| Monitoring, data access, and cybersecurity | 8% |
| CAPEX and expected lifecycle OPEX | 10% |
| Model continuity and expansion compatibility | 3% |
A hot-climate utility project may increase the weighting for thermal derating. A northern European rooftop may emphasize part-load efficiency and multiple MPPT performance. A remote project may assign more weight to availability, remote diagnostics, and spare-part logistics.
All bidders should receive the same data template. Requested information should include certified reports, efficiency curves by DC voltage, temperature derating, power-factor capability, auxiliary consumption, availability definitions, warranty exclusions, cybersecurity provisions, and replacement lead times.
A good commercial solar inverter should typically have a maximum efficiency around 98–99% and strong performance across common operating ranges. The exact target depends on project size, climate, DC design, and operating conditions rather than one headline number. Weighted efficiency, temperature behavior, and long-term reliability should also be reviewed before making a decision.
Higher inverter efficiency helps reduce energy losses during DC-to-AC conversion and can improve the amount of electricity delivered to the site or grid. However, actual production also depends on factors such as system design, weather conditions, power limitations, and equipment availability. A small efficiency advantage may have limited value if other losses are not controlled.
Inverter efficiency matters because even small losses can influence energy output over a long operating period. The impact becomes more noticeable in larger PV systems where small percentage differences represent more electricity and revenue. However, overall project performance also depends on uptime, thermal performance, maintenance needs, and operating stability.
The inverter with the highest efficiency rating is not always the best option for every PV project. Different inverter types can achieve very high efficiency levels, but their real performance depends on system configuration, installation environment, and project requirements. The most suitable choice is the option that provides the best balance between energy yield, reliability, and total ownership cost.
Neither European efficiency nor CEC efficiency is universally better because they are designed for different evaluation methods and market conditions. European efficiency may better reflect certain operating profiles, while CEC efficiency is commonly used for US project assessments. The more appropriate metric is the one that matches the project location, modeling approach, and certification requirements.
https://www.energy.ca.gov/programs-and-topics/programs/solar-equipment-lists








 Turkish
  Romanian