





The battery storage payback period is widely used as a first-screen metric in commercial and industrial solar PV projects, but it is not a final investment decision metric. While it provides a quick view of cost recovery speed, investment-grade decisions require deeper evaluation using cash-flow based metrics such as NPV and IRR. For many sites, adding battery energy storage can improve PV self-consumption, reduce demand charges, shift load into lower-cost tariff periods, support backup power, and give facility operators more control over energy use. However, storage also adds capital cost, control complexity, permitting requirements, battery degradation risk, and long-term maintenance obligations, which means payback is often used as a first-screen evaluation metric, not the final investment decision criterion.
For EPCs, resellers, installers, system integrators, and commercial project owners, the question is not simply whether batteries work. Modern lithium-ion battery energy storage systems can perform reliably when engineered, installed, and operated correctly. The real question is whether the storage asset creates enough measurable value over its operating life to justify the investment.
That outcome depends entirely on site conditions such as tariffs, load profile, and dispatch strategy. A battery that delivers strong ROI in a facility with high demand charges may underperform in a site with flat tariffs and limited price spreads. Year-one savings alone can be misleading if degradation, O&M costs, commissioning delays, or warranty limits are not properly accounted for.
In many developed markets, the C&I battery storage payback period often falls somewhere around 5–12+ years, with shorter paybacks possible where demand charges, time-of-use spreads, incentives, export restrictions, or resilience value are strong.
This variability is consistent with the IEA’s assessment that battery economics are highly dependent on local market design, electricity price structures, and the ability to stack multiple value streams rather than relying on a single revenue source.
In less favorable tariff environments, payback can extend beyond 10–15 years or fail to recover the investment within the warranted life of the system.
Battery storage payback is commonly used as a first-screen metric in commercial project evaluation, but investment decisions require deeper analysis beyond payback alone. This article explains how battery payback is calculated for commercial PV projects, what variables influence ROI, how system sizing affects economics, and what EPCs and project owners should evaluate before recommending or procuring a commercial battery energy storage system.
C&I battery economics are increasingly influenced by grid flexibility value, not only onsite bill savings. As power systems integrate higher shares of solar and wind, batteries are being used more to manage variability, peak demand, and grid constraints rather than just reduce electricity bills.
Global battery deployment is accelerating across both utility-scale and commercial segments. This growth is driven by falling technology costs, rising renewable penetration, and the need for flexible capacity in modern grids. As a result, commercial users are re-evaluating storage earlier in their PV project planning cycle instead of treating it as an optional add-on.
Storage value is typically higher in systems with high solar penetration, export limitations, curtailment risk, and strong time-of-use price differences. In these conditions, batteries can capture both energy arbitrage and system-level flexibility value.
It is also important to distinguish between battery pack price declines and total installed project cost. While battery cells and packs have become cheaper, fully installed C&I systems still include significant costs from balance of system (BOS), grid interconnection, fire safety systems, engineering, and energy management software.
In many projects, falling battery pack prices do not translate proportionally into lower installed system costs. Soft costs and compliance requirements often remain stable or even increase depending on local regulations and safety standards.
Finally, policy design, market structure, and tariff reform can change battery payback periods faster than hardware cost reductions. Changes in demand charge structures, export rules, or time-of-use pricing often have a greater impact on ROI than marginal improvements in battery pricing.
The battery storage payback period is the time required for cumulative savings and revenues from a battery system to recover the upfront investment. In a C&I PV project, those savings may come from reduced demand charges, time-of-use arbitrage, higher solar self-consumption, avoided curtailment, backup power value, grid services, or a combination of these value streams.
A simple formula is:
Simple payback period = Installed battery system cost ÷ Annual net savings
If a commercial battery system costs US$500,000 fully installed and generates US$75,000 per year in net savings after O&M, the simple payback is approximately 6.7 years. Because C&I batteries are degradable, dispatch-driven assets, this guide uses payback as the entry point but evaluates the same drivers that determine NPV and IRR. This is useful for early screening, but it is not enough for investment-grade decision-making because battery performance and cash flows change over time.
For C&I PV-plus-storage projects, there is no universal payback number. A realistic payback estimate depends on the site’s tariff structure, battery cost, PV generation profile, load profile, utility rules, incentives, cycling strategy, and financing assumptions.
A project-specific model should use interval load data, ideally at 15-minute or 30-minute resolution, together with PV production forecasts, utility tariff sheets, battery dispatch rules, degradation curves, and O&M assumptions.
For investment-grade accuracy, at least 12 months of interval load data is preferred to capture seasonal variations, demand peaks, and operational cycles. Without a full year of data, peak demand behavior may be underestimated or missed entirely.
The granularity of interval data also matters. A 15-minute interval structure versus a 5-minute interval structure can significantly change demand charge modeling outcomes, especially in markets where utility billing is based on short peak windows. Finer resolution data often reveals sharper peaks that are not visible in coarser datasets.
It is also important to recognize that a single abnormal year can distort battery sizing decisions. Unusual weather conditions, production disruptions, or temporary operational changes can lead to incorrect assumptions about typical demand behavior.
In addition, operational changes must always be incorporated into the model. These include:
Ignoring these changes can result in significant under- or over-sizing of the battery system.
A reliable payback model must therefore reflect both historical data and expected future operational conditions, not just past electricity consumption.
Based on these modeling inputs, typical commercial battery storage payback outcomes can vary significantly across different site conditions and tariff structures.
The following ranges are indicative and should not replace site-specific modeling.
| Project condition | Typical simple payback tendency |
|---|---|
| High demand charges, predictable peaks, strong controls | 3–7 years |
| Combined PV self-consumption, TOU shifting, and moderate demand charges | 6–10 years |
| Limited incentives, moderate tariffs, partial value stacking | 8–12 years |
| Flat tariffs, low export losses, weak demand charges | 10–15+ years or uneconomic |
| Critical resilience value with avoided outage costs | Site-specific, often justified beyond bill savings |
The key point is that payback is not determined by battery price alone. A low-cost battery installed at a low-value site may produce a worse financial result than a higher-quality system deployed where the tariff and load profile allow frequent, valuable dispatch.

Simple payback is best used as an initial screening metric to estimate how quickly savings recover the upfront investment. It is widely used by EPCs because it is easy to communicate, but it does not capture lifecycle degradation, dispatch variability, or replacement and augmentation requirements.
A stronger financial evaluation should also include return on investment, internal rate of return, net present value, discounted payback, and lifecycle cost of storage. These metrics account for cash-flow timing, financing cost, inflation, tariff escalation, residual value, degradation, and risk.
For example, two projects may both show a seven-year simple payback. The first may have stable savings backed by a predictable demand charge reduction. The second may depend on merchant flexibility revenue that could decline. Simple payback treats them similarly, but NPV and sensitivity analysis will show different risk profiles.
Simple payback should only be used for initial screening before detailed financial modeling. Investment-grade decisions should rely on discounted cash-flow modeling and scenario testing.
Residential batteries are often justified by self-consumption, backup power, and retail energy price avoidance. Commercial and industrial systems are different because C&I customers may be billed not only for energy consumption in kWh but also for maximum demand in kW, power quality, capacity charges, reactive power, standby service, or grid access.
This changes the design logic. A commercial battery may need high power output for short periods to reduce a monthly demand peak, while a residential battery may prioritize several hours of evening energy use. Commercial projects also require more advanced energy management systems, integration with switchgear, coordination with PV inverters and generators, and more rigorous commissioning.
In C&I projects, the battery is not just an accessory to the solar array. It is an engineered energy asset that must interact with facility operations, utility billing rules, safety requirements, and long-term asset management.
Several variables have a direct impact on the battery storage payback period. Lower installed cost helps, but it is only one part of the model. High demand charges, strong time-of-use spreads, low export compensation, reliable incentives, and frequent battery utilization can shorten payback. Poor sizing, low cycling value, weak controls, high O&M cost, or restrictive utility rules can extend payback.
Battery degradation is not a single process. As discussed earlier, degradation is driven by time and cycling behavior. Calendar degradation occurs over time regardless of usage, while cycle degradation is driven by charge and discharge activity.
Environmental conditions also matter. High ambient temperature and consistently high average state of charge can significantly accelerate both calendar and cycle degradation, reducing usable capacity earlier than expected.
Not all battery cycles have the same economic value. This is because each cycle must be evaluated not only by energy throughput, but by its marginal financial contribution after degradation cost and efficiency losses. A cycle used during a high demand charge event can generate strong savings, while a cycle used during low-price or low-impact periods may add cost without meaningful financial return.
A useful way to understand this is:
A battery used lightly for monthly peak shaving may age more from time and heat than from cycling, while a battery used daily for arbitrage may consume warranty throughput faster.
For EPCs and system integrators, one of the key risks is misalignment between physical degradation and financial value creation. A system may look profitable in annual savings but still lose lifecycle value due to fast degradation.
Battery degradation is especially important. A key strategic risk is oversizing the system beyond its monetizable dispatch potential. Larger systems may appear safer, but they can reduce utilization per kWh and extend payback if additional capacity does not generate proportional value. If the financial model assumes the battery can deliver the same kWh output in year ten as in year one, payback may be overstated. Warranty terms also matter because many warranties include throughput limits, temperature limits, depth-of-discharge assumptions, and capacity retention conditions.
For this reason, dispatch strategy should be treated as an economic optimization problem rather than a simple control function.
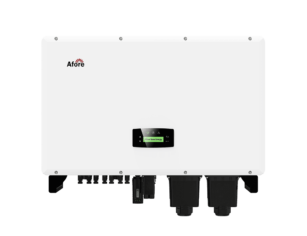
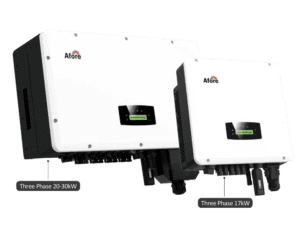
Commercial battery storage ROI depends on the relationship between all-in system cost and the monetizable value created by dispatch. To achieve higher efficiency and dispatch flexibility, system design often relies on advanced inverter integration such as hybrid architectures and energy storage inverters. A complete model should include CAPEX, OPEX, tax or incentive treatment, performance degradation, financing, and the timing of savings.
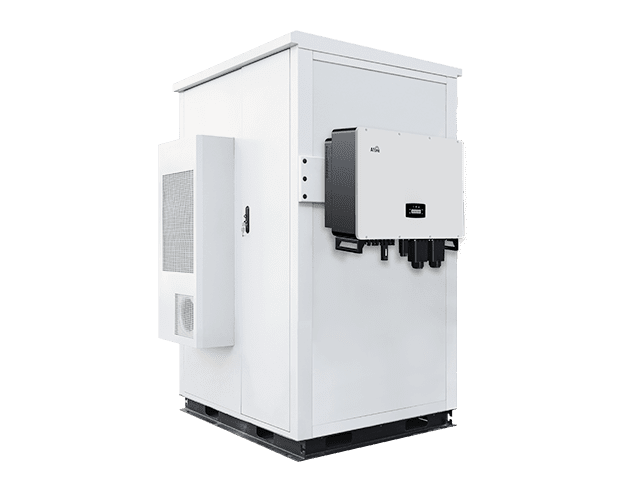
The battery modules or racks are only part of the battery energy storage system cost. Commercial projects also require power conversion systems, battery management systems, energy management software, switchgear, protection equipment, metering, cabling, enclosures or containers, HVAC or thermal management, fire detection and suppression where required, foundations or civil works, commissioning, grid studies, and permitting.
For smaller C&I installations, soft costs can represent a significant share of total project cost because engineering, permitting, integration, and commissioning do not scale down perfectly. For larger systems, transformer upgrades, protection studies, grid compliance, and site works can materially affect payback.
| Cost category | Typical impact on payback |
|---|---|
| Battery racks or cabinets | Major CAPEX driver, linked to kWh capacity |
| PCS/inverter equipment | Determines power rating and dispatch capability |
| EMS and controls | Critical for peak shaving and value stacking |
| Fire safety and enclosure systems | Can add cost but reduce permitting and insurance risk |
| Engineering, permitting, commissioning | Often underestimated in early proposals |
| Grid upgrades and interconnection studies | Can delay project and increase effective payback |
Underquoting these items may help win a proposal but creates project delivery risk. A defensible payback analysis should reflect the actual installed and commissioned cost, not only the battery hardware price.
Battery systems are not maintenance-free assets.
OPEX may include preventive maintenance, remote monitoring fees, and software subscriptions.
It may also cover safety inspections, firmware updates, spare parts, capacity testing, and service visits.
Battery degradation includes both calendar degradation and cycle degradation. Calendar aging continues even when the system is idle, while cycle aging is driven by charge-discharge activity.
A key operating principle is that not all cycles should be executed equally. From a lifecycle economics perspective, each dispatch should be evaluated against its total cost, including degradation, efficiency losses, and operational constraints.
A simple LCOS-style discipline can be applied:
A cycle should only be executed when its value is higher than the combined cost of degradation and efficiency loss.
This means dispatch decisions should not only optimize annual revenue, but also maximize value per cycle, not gross energy throughput.
Larger C&I systems may require augmentation planning if a minimum usable capacity must be maintained for contract performance. For example, a system designed to deliver a guaranteed 1 MWh of usable energy for 10 years may need either initial oversizing or later module augmentation.
Both options affect payback differently. A project can appear profitable on year-one savings but underperform over 10–15 years if degradation and lifecycle cost are ignored.
Before stacking revenue streams, each value source should be evaluated across four filters: technical feasibility, tariff or contractual eligibility, dispatch compatibility with other functions, and net-positive contribution after accounting for losses, degradation, and operational constraints. Only value streams that pass all four layers should be included in the payback model.
Commercial battery projects typically rely on stacked value streams rather than a single revenue source. However, not all value streams are equal. They should be separated into four categories:
According to the U.S. Department of Energy, energy storage systems can provide multiple value streams, including renewable energy integration, grid flexibility, demand management, and resilience services. The economic value of storage depends on how effectively these services can be combined and monetized within specific market and operational conditions. Therefore, commercial storage projects should evaluate multiple revenue streams rather than relying on a single savings mechanism.
Demand charge reduction may provide the strongest base case in some markets. Time-of-use arbitrage may add value where peak and off-peak spreads are meaningful. PV self-consumption becomes important where export compensation is low or capped. Backup power may create additional value where outages cause production loss, spoilage, or safety risk.
Grid services may also improve economics, but only when technically feasible, contractually allowed, and dispatch-compatible with onsite operations.
Revenue stacking can shorten payback, but double-counting must be avoided. A battery cannot always perform every function at the same time.
A credible financial model should test best-case, base-case, and conservative scenarios. EPCs should examine how payback changes if demand charges escalate more slowly than expected, incentives are delayed, battery replacement cost remains high, load growth changes peak timing, or the customer’s operating schedule changes.
Sensitivity analysis is also important because battery cost trends are not linear. Battery pack prices have declined significantly over the last decade, but installed system costs can still fluctuate due to supply chain constraints, shipping cost, local electrical requirements, fire safety upgrades, and project complexity.
A practical model should test at least the following variables: installed cost, demand charge savings, TOU spread, annual cycles, battery degradation, O&M cost, incentive availability, financing rate, downtime, and terminal value. If a project only works under optimistic assumptions, it should be presented as a higher-risk investment.
Battery sizing has a major effect on PV-plus-storage economics. The most profitable system is often not the largest possible battery, but the one that captures the highest-value savings with the least unused capacity.
Battery systems have two key ratings: power and energy.
For investment-grade modeling, the following minimum inputs are required to correctly size kW and kWh:
Without these inputs, battery sizing is typically based on assumptions that can lead to significant over- or under-performance in real-world operation.
Power (kW) defines how fast the battery can charge or discharge, while energy (kWh) defines how long it can sustain that output.
Battery duration has a direct impact on ROI and system design. In commercial applications, common configurations include 0.5-hour, 1-hour, 2-hour, and 4-hour systems, each aligned with different value streams.
The key implication is that battery duration determines not only energy capacity but also the type of revenue the system can realistically capture.
The ROI profile can vary significantly across durations. A 0.5-hour system may achieve strong payback in demand charge-heavy sites but provide limited energy shifting capability. A 4-hour system may increase total energy coverage but risk underutilization if the tariff structure does not support long discharge windows.
Overbuilding duration can reduce utilization and weaken payback. More MWh does not automatically translate into more savings if most of the financial value is concentrated in short peak windows.
For EPCs, the key design question is not “how large should the battery be,” but “how long does it need to discharge to capture the highest-value events in the tariff structure.”
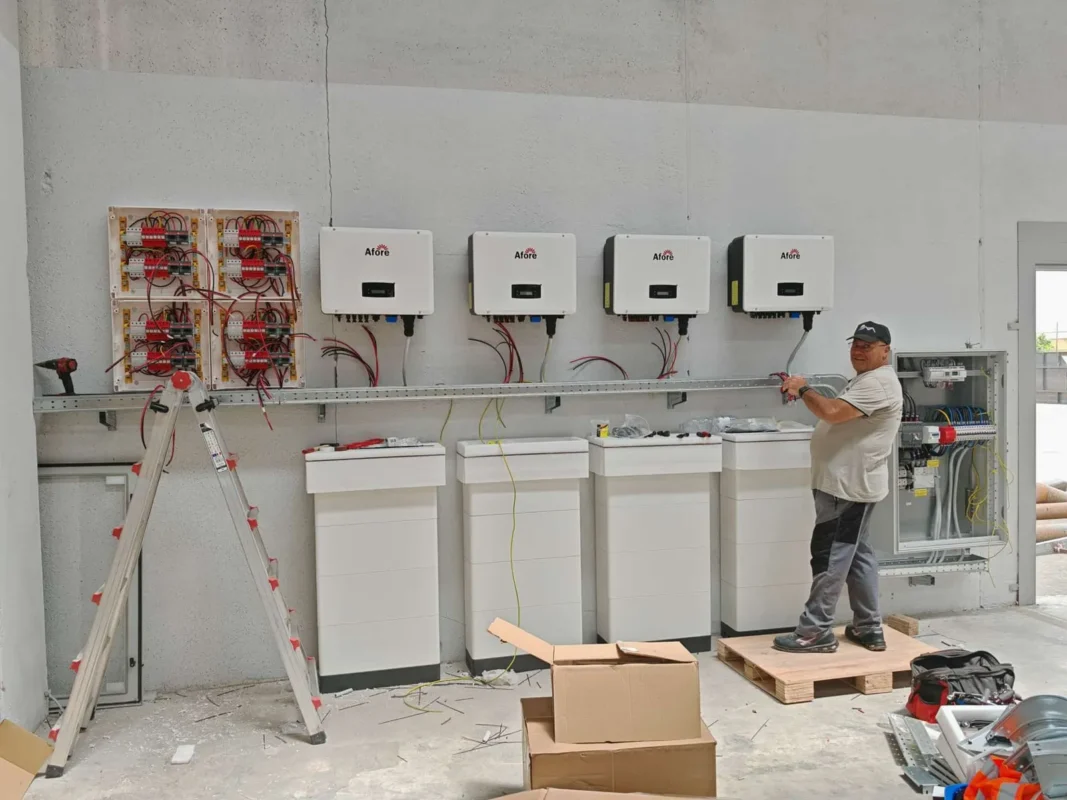
Oversizing increases upfront capital cost and reduces utilization efficiency when additional energy capacity does not translate into proportional dispatch value. A 1 MWh system that captures most peak shaving value may deliver higher return efficiency than a 2 MWh system that operates below optimal utilization.
Oversizing can still be justified when the design objective includes resilience, load growth, EV charging expansion, or end-of-life capacity retention. In these cases, the additional capacity should be treated as a separate design objective rather than embedded into pure payback calculations.
System sizing should be driven by site-specific dispatch constraints, including export limits, demand charge structure, PV coincidence, tariff windows, and operational load patterns. A PV system does not define battery size; the value structure does.
System architecture affects efficiency, installation cost, expandability, and payback. AC-coupled batteries connect on the AC side of the electrical system and are often easier to retrofit into existing PV sites. They can operate independently of the PV inverter and may provide flexible control for demand management or backup integration.
DC-coupled systems connect the PV and battery on the DC side before conversion to AC. In new-build PV-plus-storage projects, DC coupling may reduce conversion losses when storing PV energy directly, and it can help manage clipped PV energy in systems with inverter loading ratios. However, it may add design complexity and can be less straightforward for retrofits.
| Architecture | Common advantage | Payback consideration |
|---|---|---|
| AC-coupled storage | Flexible retrofit and independent battery dispatch | May involve additional conversion losses |
| DC-coupled storage | Efficient PV-to-battery charging in some new builds | Requires careful inverter and controls design |
| Hybrid inverter architecture | Integrated PV and battery control | Compatibility and expansion limits must be checked |
The best architecture depends on site layout, existing PV equipment, grid connection limits, metering configuration, future expansion plans, and operating objectives.
Battery sizing should be based not only on energy capacity but also on discharge duration. For backup-oriented systems, reserve strategy is different from revenue-maximizing dispatch. A portion of the battery capacity must be reserved and not used for arbitrage or peak shaving in order to ensure availability during outage events.
Battery capacity should be determined primarily by discharge duration and value timing.
As discussed in the previous section, common commercial configurations include 0.5-hour, 1-hour, 2-hour, and 4-hour systems, each aligned with different value streams such as peak shaving, PV shifting, or resilience.
In practical design, the optimal capacity is not defined by maximum storage size, but by the duration of the highest-value grid events under the site’s tariff and load structure.
longer-duration system may still be appropriate when resilience, EV expansion, or future load growth is a key design constraint, but it should not be assumed that more capacity automatically improves payback.
For example:
The optimal design is therefore defined by value timing, not maximum capacity. The correct battery size is the one that matches the duration of the highest-value grid events.
The strongest C&I battery projects are usually built around a clear primary value stream and supported by secondary value streams. The value stack must be technically compatible and commercially realistic.
In addition to bill savings, commercial battery systems also create resilience value, which should be evaluated separately from standard payback calculations.
Resilience value can be structured into three levels:
1. Critical load support The battery supports essential systems such as lighting, IT systems, refrigeration, or safety equipment during short interruptions.
2. Ride-through or bridging support The system maintains operations during short outages until grid power returns or backup generators start.
3. Long-duration outage support The system provides extended backup during prolonged grid outages, reducing downtime and operational disruption.
The economic impact of outages can be categorized into multiple cost types:
These costs can significantly exceed annual electricity bill savings in high-value industrial or commercial sites.
To quantify resilience value, a simple framework can be used:
Resilience value = (Probability of outage) × (Expected outage duration) × (Cost per hour of downtime)
This transforms resilience from a qualitative benefit into a measurable financial input.
It is important to note that resilience value is often independent of energy arbitrage or demand charge savings. For this reason, resilience should usually be modeled separately from simple payback calculations to avoid mixing risk reduction with operational savings.
Demand charge reduction is one of the strongest use cases for commercial battery storage in markets where utilities bill customers based on monthly maximum kW demand. A battery can discharge during peak events to reduce the billed peak and lower recurring charges.
For example, if a site can reduce its billed peak by 300 kW and the demand charge is US$20/kW/month, the monthly savings are approximately US$6,000, or US$72,000 per year. That level of savings can materially improve payback, especially if the required discharge duration is short.
However, peak shaving depends on accurate forecasting and reliable controls. If the battery discharges too early and a higher peak occurs later, savings may be lost for the entire billing period. EMS performance is therefore central to ROI. The control system must understand load patterns, PV output, state of charge, tariff rules, and operational constraints.

Time-of-use arbitrage charges the battery during low-cost periods or from excess PV and discharges during high-cost periods. The value depends on the spread between off-peak and peak rates after accounting for round-trip efficiency and degradation cost.
If off-peak energy costs US$0.10/kWh and peak energy costs US$0.25/kWh, the gross spread is US$0.15/kWh. With 90% round-trip efficiency, the net value is lower because more energy must be charged than discharged. The model must also account for battery cycling cost and any restrictions on charging from the grid.
Arbitrage alone is often insufficient when price spreads are small. In many C&I projects, it works best as a secondary value stream combined with demand charge reduction or PV self-consumption.
Where export compensation is low, capped, or unavailable, storage can improve PV-plus-storage economics by storing midday solar generation for later onsite use. This is especially relevant for warehouses, factories, schools, retail centers, cold storage facilities, and office buildings with load peaks outside solar production hours.
The value of self-consumption is the avoided retail import price minus the export payment that would otherwise have been received. If exported PV earns little or nothing, the stored energy may be worth close to the full avoided retail rate, minus efficiency losses and degradation.
Storage can also help when grid export limits restrict PV system size. In some projects, adding a battery allows more PV generation to be used onsite without violating export constraints. This can improve the combined economics of the PV and battery system.
Battery storage can be profitable without incentives, but only under the right conditions. Sites with high demand charges, strong TOU spreads, export limitations, predictable load peaks, or high outage costs may justify storage on economics alone. However, incentives can materially shorten payback and improve bankability.
Project owners should model the battery both with and without incentives. This avoids dependence on uncertain funding, delayed approvals, or changing eligibility rules. For EPCs, this is also important for customer trust. A proposal that only works with optimistic incentive assumptions may create commercial risk if the incentive is reduced, oversubscribed, or unavailable at commissioning.
Product selection directly affects payback because safety, efficiency, warranty performance, and serviceability determine whether modeled savings are actually delivered over time.
Lithium iron phosphate is widely used in stationary commercial storage because of its thermal stability, cycle life, and suitability for daily cycling. Other lithium-ion chemistries may offer higher energy density, but stationary C&I projects usually prioritize safety, durability, warranty clarity, and lifecycle cost over compactness alone.
Important selection factors include usable depth of discharge, cycle life, temperature tolerance, energy density, safety characteristics, enclosure rating, and suitability for the intended dispatch profile. A battery used for daily cycling requires a different warranty and degradation profile than one used mainly for backup.
Second-life batteries may reduce upfront cost, but they introduce additional uncertainty around remaining useful life, safety certification, performance consistency, and warranty bankability. For financeable C&I projects, lower CAPEX should be weighed against higher due diligence and performance risk.
Nominal capacity is not the same as usable capacity. A battery sold as 1 MWh may provide less usable energy depending on depth-of-discharge limits, state-of-charge reserves, warranty conditions, and control settings.
Round-trip efficiency also affects savings. Round-trip efficiency varies by system design, operating conditions, and control strategy. Lower efficiency reduces arbitrage and self-consumption value because some energy is lost during charge and discharge.
EPCs should verify manufacturer degradation curves, capacity retention guarantees, and performance assumptions. A headline kWh figure is not enough. The financial model should reflect usable capacity over time, not only nameplate capacity at commissioning.
The battery, power conversion system, PV inverter, grid protection equipment, and EMS must operate as an integrated system. Compatibility issues can cause commissioning delays, reduce dispatch flexibility, or prevent value stacking.
In retrofit projects, integration is often more complex because existing PV inverters, meters, switchgear, and building management systems may not have been designed for storage. In multi-vendor systems, communication protocols, control hierarchy, and responsibility boundaries must be clearly defined.
The EMS is especially important in commercial projects. It must optimize dispatch according to tariff periods, load forecasts, PV output, battery state of charge, demand charge risk, backup reserve requirements, and market participation signals where applicable.
A battery warranty should be read as a financial document, not only a technical document. Key terms include warranty duration, cycle or throughput limits, capacity retention guarantees, operating temperature range, required maintenance, monitoring obligations, exclusions, and claim procedures.
After-sales support also affects lifecycle value. Spare parts availability, remote diagnostics, response times, local service capability, technical documentation, and supplier financial stability all influence risk. For resellers and EPCs, serviceability is not a secondary issue. It determines whether the customer receives the savings promised in the business case.
Battery storage can change a site’s electrical behavior. It may increase import capacity, enable export, alter fault current characteristics, or require new protection settings. These issues can materially affect cost and project timeline.
Adding storage may trigger interconnection review by the utility, distribution network operator, or grid authority. The process may examine export limits, transformer capacity, protection coordination, anti-islanding, metering configuration, power quality, and communication requirements.
Export control is especially important in PV-plus-storage projects. If a site has a zero-export or limited-export agreement, the control system must prevent unauthorized export from both PV and battery discharge. Failure to manage this correctly can delay approval or violate interconnection terms.
EPCs should review grid connection requirements before finalizing battery size and architecture. A technically attractive system may become uneconomic if it requires major transformer upgrades or extended interconnection studies.
Commercial battery systems must comply with local electrical codes, fire safety rules, product standards, ventilation requirements, spacing rules, emergency shutdown requirements, signage, and access provisions. Requirements vary by jurisdiction and project scale, but they should be addressed early in design.
Fire safety planning may affect battery placement, enclosure type, separation distances, detection systems, suppression systems, drainage, emergency response access, and insurance acceptance. These factors can increase installed cost, but ignoring them can cause redesigns, permitting delays, and commissioning risk.
For international EPCs and suppliers, certification alignment is critical. Product documentation should support the standards and regulatory requirements of the target market, not only the manufacturer’s domestic market.
Some commercial batteries can participate in demand response, frequency regulation, capacity markets, or virtual power plant programs. These revenues can improve payback, particularly for larger systems or portfolios of aggregated sites.
However, eligibility must be confirmed before including these revenues in the base case.
Grid service value streams should also be separated into three layers:
Only contractually eligible and dispatchable revenue should be included in base-case payback assumptions.
Market participation may require minimum capacity, certified metering, telemetry, dispatch response testing, aggregator contracts, communication protocols, and availability commitments. If the battery is also needed for onsite backup or peak shaving, the control strategy must allocate capacity carefully.
Merchant or market-based revenues should usually be modeled with conservative assumptions unless they are contracted.
Utility rules can change the financial outcome more than battery chemistry or hardware price. Net metering, net billing, export tariffs, demand charge structures, standby charges, interconnection fees, import/export metering, and operating restrictions all shape ROI.
For example, a battery may be highly valuable where exported PV receives little compensation. In a market with full retail net metering, the incremental value of storing PV may be much lower. Similarly, a site with high demand charges may benefit strongly from peak shaving, while a site on a flat energy-only tariff may not.
Before finalizing design, project teams should review tariff sheets, interconnection agreements, export rules, and any applicable grid service programs. Battery dispatch should be modeled against the actual tariff, not a simplified electricity price.
Even when the financial model is strong, execution risk can extend the effective payback period. Delays, redesigns, underperforming controls, or incomplete commissioning can reduce first-year savings and create disputes.
A commercial battery site assessment should evaluate available space, floor loading, outdoor cabinet placement, maintenance access, cable routing, flood risk, ventilation, ambient temperature, security, fire access, and proximity to switchgear. Indoor installations may require additional fire-rated rooms, ventilation, and access controls. Outdoor installations may require foundations, bollards, drainage, weather protection, or temperature management.
Thermal conditions are particularly important. High ambient temperatures can increase auxiliary loads, reduce battery performance, and accelerate degradation. Cold conditions may reduce charge acceptance or require heating. These effects should be included in both design and payback assumptions.
Commissioning should confirm battery capacity, PCS operation, EMS dispatch logic, metering accuracy, safety systems, communication links, protection settings, remote monitoring, and grid response.
In commercial projects, commissioning is not only a technical validation step but also a contractual milestone tied to performance guarantees. These guarantees may be linked to peak shaving performance, system availability, or minimum usable energy capacity at COD (commercial operation date).
It is important to distinguish between an equipment warranty and a project performance guarantee. An equipment warranty covers hardware defects, degradation thresholds, and manufacturer responsibility. A performance guarantee defines whether the system actually delivers agreed operational outcomes under real site conditions.
Measurement and verification (M&V) boundaries must be clearly defined before commissioning. This includes identifying:
Without clear M&V definitions, the same system can produce different savings results depending on interpretation of load baseline or tariff structure.
Example performance guarantee language in commercial contracts may include:
In many projects, guaranteeing a methodology for savings calculation is more realistic than guaranteeing a fixed savings amount, since tariffs, load profiles, and dispatch conditions may change over time.
A structured commissioning process reduces disputes by ensuring that performance expectations are technically measurable, contractually defined, and aligned with real operating conditions.
Commercial sites increasingly combine PV, storage, diesel generators, EV chargers, HVAC controls, and building management systems. Proper integration can increase value by coordinating loads and generation. Poor integration can create conflicts.
For example, EV charging may create new demand peaks that the battery can mitigate. However, if EV charging schedules are unpredictable, the battery may need more advanced forecasting. A diesel generator may provide backup, while the battery supports fast response and critical load bridging. HVAC loads may be pre-cooled or shifted to reduce peak demand.
The controls strategy should define priorities. During a high-tariff period, should the battery reduce demand, preserve backup reserve, charge from PV, support EV charging, or respond to a grid event? Without clear logic, value stacking can fail in operation.
Commercial customers need clear documentation and training. Handover should include as-built drawings, single-line diagrams, equipment manuals, emergency procedures, monitoring access, warranty documents, maintenance schedules, commissioning records, and escalation contacts.
Operator training should explain normal operating modes, alarm response, safety procedures, backup limitations, and performance review responsibilities. This is especially important where facility staff can override settings or where production schedules affect battery dispatch.
A well-documented handover protects long-term ROI because it reduces downtime, avoids improper operation, and supports warranty compliance.
The payback model does not end at commissioning. Batteries require active monitoring and lifecycle management to ensure that actual performance matches the business case.
Asset managers should track technical and financial KPIs together. Important operating metrics include state of charge, state of health, charge and discharge cycles, round-trip efficiency, system availability, peak reduction achieved, tariff savings, fault events, auxiliary consumption, and EMS dispatch accuracy.
| KPI | Why it matters |
|---|---|
| State of charge | Shows whether capacity is available for dispatch or backup |
| State of health | Tracks degradation against warranty expectations |
| Cycle count and throughput | Indicates utilization and warranty consumption |
| System availability | Measures downtime impact on savings |
| Peak reduction achieved | Confirms demand charge performance |
| Round-trip efficiency | Affects arbitrage and self-consumption value |
| Fault events | Identifies reliability or integration issues |
Actual performance should be compared with the original financial model. If savings are lower than expected, early software optimization may recover value before losses accumulate.
O&M may include firmware updates, enclosure inspections, thermal management checks, electrical testing, communication checks, filter replacement, safety system verification, and capacity testing. Remote diagnostics can reduce downtime and unnecessary site visits, but service responsibilities must be clearly defined in contract terms.
For EPCs and resellers, O&M planning is part of commercial risk management. A project with unclear maintenance responsibility may suffer avoidable downtime, warranty disputes, or customer dissatisfaction.
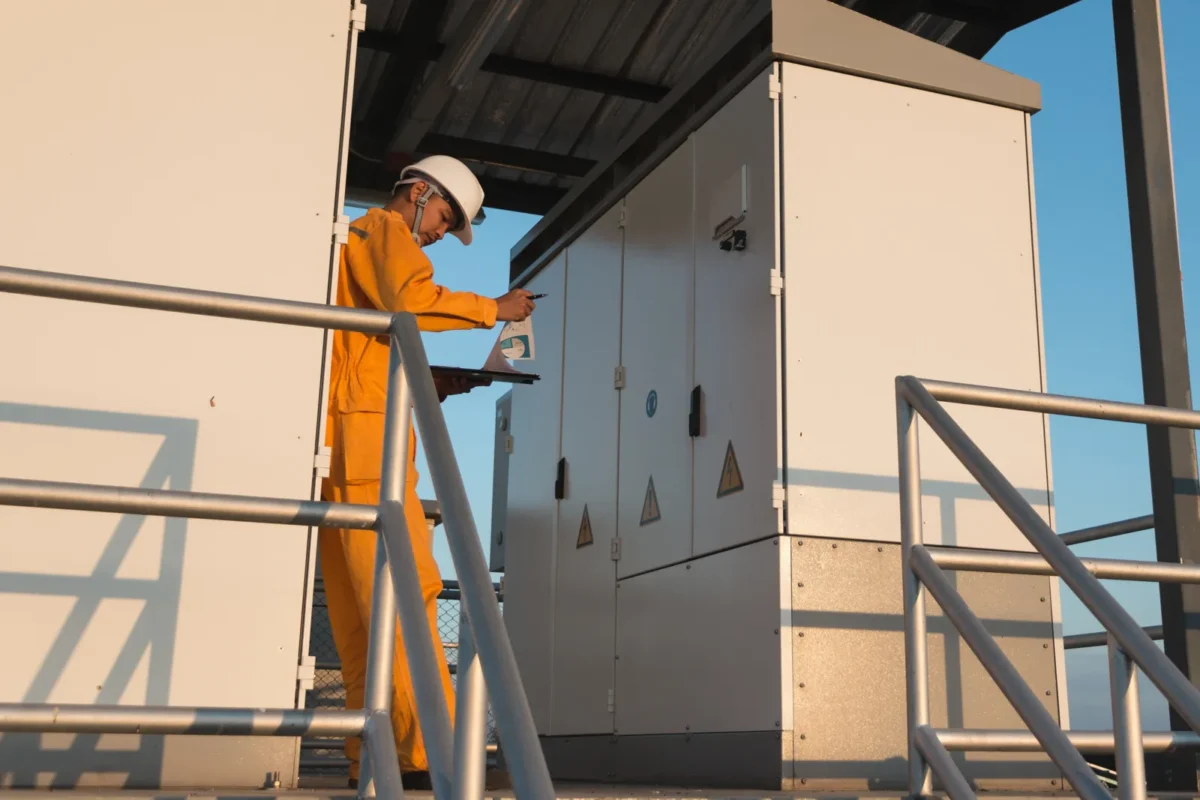
Battery degradation depends on cycling intensity, depth of discharge, average state of charge, charge and discharge rates, and operating temperature.
Throughput-limited warranties can significantly constrain how much of the battery’s capacity can be economically monetized over its lifetime. Even if a battery is technically capable of more cycling, warranty caps may restrict usable dispatch if the operator wants to avoid premature capacity degradation or warranty violations.
For this reason, dispatch optimization should always account for warranty throughput constraints when evaluating and monetizing different value streams such as peak shaving, arbitrage, or grid services.
Operating outside specified conditions can reduce warranty protection. This includes temperature excursions, excessive depth of discharge, unauthorized control changes, improper maintenance, or communication failures that prevent monitoring.
If performance falls below expectations, the first step is to diagnose whether the issue is technical, operational, or commercial.
In many real-world cases, underperformance is not caused by equipment failure, but by changes in the original assumptions used to define system performance. These include updates in site load patterns, shifts in production schedules, or changes in tariff structures that affect how savings are measured.
The battery may be functioning correctly, but the load profile may have changed. Alternatively, the EMS may be missing peaks, metering may be inaccurate, or usable capacity may be lower than expected.
Contracts can reduce risk through performance guarantees, service-level agreements, response-time commitments, capacity testing procedures, and defined remediation processes. Remedies may include software optimization, equipment repair, module replacement, dispatch strategy changes, or financial compensation where applicable.
For project owners, underperformance affects cash flow directly. For EPCs, it affects reputation and warranty exposure. This is why commissioning, monitoring, and clear contract terms are essential to battery storage payback.
Procurement should evaluate total lifecycle value, not only purchase price. A low-cost battery system may produce a longer payback if it increases installation complexity, limits dispatch flexibility, carries weak warranty terms, or lacks reliable support.
Vendor evaluation should consider product certification, project references, warranty strength, technical documentation, PCS and EMS compatibility, local support, spare parts availability, delivery reliability, training, and commissioning support.
It is also critical to distinguish between equipment warranty and project performance guarantees, as some suppliers only guarantee hardware performance while leaving system-level outcomes (such as savings or availability) to EPC or integrators.
For channel partners, product margins must be balanced against serviceability. A storage product that is difficult to commission or support can erode profitability through repeated site visits, delayed handover, or unresolved performance issues.
The lowest upfront quote does not always produce the shortest payback. Total cost of ownership should include installation labor, auxiliary equipment, fire safety systems, monitoring fees, O&M, software licenses, degradation, replacement risk, warranty limitations, and downtime.
A higher-quality system with better efficiency, clearer warranty terms, stronger EMS controls, and reliable support may deliver stronger lifecycle economics than a cheaper system that underperforms.
Financing changes how customers perceive payback. A direct purchase places CAPEX and operating risk with the project owner. A lease or energy-as-a-service model converts the investment into recurring payments. A solar-plus-storage PPA may transfer ownership and performance responsibility to the provider. Shared savings structures align payment with realized savings, but require accurate measurement and verification.
Each model changes risk allocation, tax treatment, balance sheet impact, and payback visibility. From the customer’s perspective, a service model may create immediate net savings without upfront CAPEX. From the provider’s perspective, the underlying asset still requires disciplined payback modeling.
Battery procurement should account for lead times, shipping constraints, local certification, spare parts, modular expansion, and installation sequencing. EPCs should also consider future load growth, additional PV capacity, EV charging, electrification of heating or process loads, and portfolio replication.
A modular architecture may allow the customer to begin with a financially optimized system and expand later as load or tariffs change. However, expansion must be planned early so that switchgear, space, communications, and grid approvals do not become barriers.
For multi-site businesses and EPCs serving repeat commercial customers, battery storage should be evaluated at both site and portfolio levels. Portfolio data can improve sizing, procurement, O&M, and future payback accuracy.
Standardized battery configurations can reduce engineering time, simplify procurement, improve installer training, and streamline O&M. This is useful for retail chains, logistics portfolios, schools, industrial parks, and distributed commercial property owners.
However, standardization should not override tariff-specific and load-specific sizing. Two facilities with the same PV capacity may need different batteries if one has high demand charges and the other has low export compensation.
Real operating data is extremely valuable. EPCs and resellers can improve future proposals by tracking actual demand reduction, cycle patterns, downtime, service costs, degradation, customer load changes, and tariff savings across deployed systems.
This feedback loop improves proposal accuracy and reduces the risk of overpromising. It also helps identify which customer segments produce the strongest commercial battery storage ROI.
Battery storage can support EV charging infrastructure, microgrid operation, backup power, power quality improvement, and grid flexibility. In many commercial projects, investment decisions are based on a combined model of financial ROI and risk reduction, rather than bill savings alone.
In these cases, storage value comes from both measurable energy cost savings and the avoided cost of operational disruption, system downtime, or infrastructure upgrade deferral.
For example, a facility may avoid or defer a transformer upgrade by using a battery to buffer EV charging peaks. A cold storage site may value outage protection more than arbitrage savings. A manufacturer may use storage to reduce production interruptions or support power quality.
These benefits should be quantified where possible. Where they cannot be precisely monetized, they should be separated from bill savings so decision-makers understand the difference between financial return and strategic value.
PV-only may be the better choice when export compensation is favorable, demand charges are low, TOU spreads are weak, resilience is not required, incentives are unavailable, or the site has limited space and high installation complexity. In these cases, adding batteries may extend payback without adding enough value.
PV-plus-storage becomes stronger when the site has high-value peak shaving, poor export economics, strong evening tariffs, frequent curtailment, critical backup needs, or access to grid service revenue. The decision should compare PV-only, PV-plus-storage, battery-only, and no-action scenarios under the same assumptions.
The best recommendation is not always to add storage. For professional EPCs and advisors, credibility comes from identifying where storage creates value and where it does not.
The battery storage payback period should be treated as the output of a project-specific engineering and financial model, not as a generic market average. For C&I PV projects, the strongest business cases are built on interval load data, actual utility tariffs, realistic dispatch logic, full installed cost, warranty-aware degradation assumptions, and clear O&M responsibilities.
For EPCs, installers, resellers, and commercial project owners, the most bankable storage project is not necessarily the largest or lowest-cost system. It is the system that captures high-value savings reliably, complies with grid and safety requirements, can be commissioned without control conflicts, and continues to perform over its expected operating life.
A typical C&I battery storage payback period is around 5–12 years, depending on tariffs, demand charges, system cost, incentives, and utilization. It can be as short as 3–7 years in high demand-charge or strong TOU pricing environments. At flat-tariff sites, payback may extend to 10–15+ years or exceed system warranty life.
Simple payback is only a screening metric and requires interval load and tariff-specific modeling for accuracy.
Payback period = fully installed system cost ÷ annual net savings. Net savings include demand charge reduction, TOU arbitrage, PV self-consumption, export loss avoidance, and O&M costs. This provides a first-pass estimate but does not capture degradation or financial effects. Final decisions should use NPV or IRR-based discounted cash flow analysis.
Yes, when it reduces demand charges, improves PV self-consumption, enables tariff arbitrage, or adds resilience value.
No, when the system is oversized, underutilized, or installed in a low-value tariff environment. ROI depends strongly on tariff structure and dispatch utilization quality. Underutilized batteries can reduce overall solar returns by increasing CAPEX without proportional savings.
In many commercial markets, demand charge reduction is one of the strongest battery value streams where demand charges are significant. The savings depend on the demand charge rate, peak predictability, battery power rating, discharge duration, and EMS control accuracy. This is often stronger than time-of-use arbitrage, which depends primarily on peak/off-peak price spreads and cycle efficiency losses.
No. PV-only may be more economical where export compensation is strong, demand charges are low, and there is no meaningful need for peak shaving, backup power, or load shifting. PV-plus-storage is more attractive when the site can monetize demand reduction, time-of-use shifting, self-consumption, backup value, or grid flexibility. The comparison must always use the same tariff structure, load profile, and cost assumptions to be valid.
https://www.iea.org/reports/batteries-and-secure-energy-transitions
https://www.energy.gov/oe/energy-storage-grand-challenge-roadmap









 Turkish
  Romanian